What is an employee's KPI. KPIs - what is it? KPI - key performance indicators. KPI development. Optimal timing of KPI implementation
Calculating KPI progress is the heart of the pay system. The mechanism for calculating and accruing bonuses depends on it, and, therefore, the effect of the entire motivation system. However, from what I see in most organizations, today's managers still don't see how to do this simply and effectively. As a result, cumbersome, complex, and mostly unworkable schemes are devised to pay staff. Or even worse - they make a commission scheme for salespeople, and for everyone else "according to the results of the company's work." We will talk about the dangers of these approaches separately.
In fact, the secret to calculating KPI is quite simple and consists in one single and rather trivial formula. But instead of it, in practice, for some reason, several extremely inefficient schemes have become widespread, which usually greatly interfere with the implementation of KPI in organizations. And the worst thing is that even in the specialized literature nothing sensible has been written about this.
So, let's try to figure out how the degree of KPI fulfillment is usually calculated, why this should not be done, and how it should be done in order to get the result you need.
1. Plan-fact
This is the easiest and most obvious way, because. any key performance indicator (KPI, KPI) reflects the goal, and the goal must have a measurable expression - a plan. There can be no KPI without a plan. Accordingly, the first thing that comes to mind is to divide the fact into a plan. For example, the sales plan is 1.5 million rubles, and the actual is 1.35 million. Accordingly, the degree of implementation will be 1.35 / 1.5 = 90%. For a plan-fact analysis, such a formula is absolutely justified, however, we are talking about the calculation of KPI fulfillment for further bonus accrual. In this case, we do not take into account the commission scheme.So what to do in the given example? Pay an employee 90% of the planned bonus? It seems logical if the plan is 90% fulfilled. And what if the plan is fulfilled by 50% - pay half the premium? But after all, if the sales plan is only half completed, then the company is most likely already in a very difficult situation. Products have a cost, the organization has indirect costs that must be covered from the markup. Today is no longer the 90s, and if the sales plan is half completed, then the organization will most likely incur losses, which means that it will have to optimize costs, reduce staff, or even worse. Paying a premium in such a situation (even half) is tantamount to suicide.
In one organization, a special condition was introduced for this case: if the degree of fulfillment of KPI (calculated according to the fact / plan formula) is less than 50%, no bonus is accrued. Well done, they insured themselves against the payment of bonuses in case of bankruptcy, but in such a situation, half of the bonus fund is used inappropriately. In fact, in that organization, all plans were guaranteed to be fulfilled by 70-80% - the business has a certain inertia. The struggle was for the last 20-30%. It really takes some effort to get them. But with the fact / plan execution formula, this is the targeted use of the bonus fund by only 20-30%, the rest of the payments are guaranteed to all employees. And why strain for a 20% bonus, which is about 30% of the total salary, because it is only about 6% of the total salary (0.2 x 0.3 = 0.06). This reward system just doesn't work.
This is where the first important rule comes in:
Every KPI except the plan should be critical
This truth has long been evident in Western companies that have been saturated over the past decades with quality management systems, performance management technologies, and so on.
critical value for simple direct indicators (the more, the better) - this is the minimum below which the fact according to KPI should in no case fall. For example, the plan is to process 97% of customer requests on time, the critical value is 92% of requests. Below this threshold, contract penalties begin and clients change service providers. For reciprocal indicators, the critical value is the allowable maximum. For example, the plan for the level of marriage is no more than 1.5% of the output, the critical value is 5% (in this case, we stop the line).
Tolerance is the difference between the planned and critical value. In the first example, 5% (97-92), in the second - -3.5% (1.5-5). In real life, the struggle for actual KPI values is carried out precisely within the limits of permissible deviations. And it is within this framework that the degree of fulfillment and the premium should be calculated. But the simplest fact / plan formula does not take this into account in any way.
2. Tables of values
Many managers intuitively understand this problem, but, not knowing the professional means of solving it, they do what they saw somewhere. So, in practice, substitution tables have become widespread, in which certain intervals of indicator values \u200b\u200band the index of the degree of completion corresponding to each of the intervals are indicated. Surely each of you at least once in your life has come across such things:| No. p / p | Intervals of KPI fulfillment deviations from planned values | Percentage adjustment of the planned amount of remuneration |
| 1 | from 97% and above | 100% |
| 2 | from 90% to 96.9% | 75% |
| 3 | from 85% to 89.9% | 50% |
| 4 | from 80% to 84.9% | 25% |
| 5 | below 80% | 0% |
At first glance, it seems that the problem has been solved: the degree of completion now takes into account the critical value of the indicator, the degree of implementation is more sensitive to changes in the indicator, which is what we wanted to achieve. Apparently, because of the seeming simplicity of solving the table of values, they have become so widespread. In practice, they have a number of very significant drawbacks:
- When using such tables the premium becomes discrete, insensitive to small changes in the indicator. For example, in the above example, the premium will be the same at 91% and 96% performance. And for a company, such a fluctuation can cost half or a quarter of the profits. But the difference between 89.9% and 90% is a quarter of the premium, and the company may not notice such a fluctuation or it may be caused by measurement error. This is unfair and makes the premium accrual random.
- It is relatively convenient to use this kind of tables when all indicators in the company are straight lines (the more, the better) and have the same tolerance. For example, 20% of the plan, as in our example. But what if some of the indicators are inverse (budget savings, reduced scrap), and the permissible deviations differ for them? For example, the allowable deviation for the level of marriage is 5%, for revenue - 20%, and for overdue receivables - 50% of the plan. In this case, it is necessary to develop a separate table for each indicator. What if tolerances vary by season? For example, in our peak season, the allowable deviation in revenue is 25%, and in the low season - 50%. As a result, for each indicator for each calendar period, it will be necessary to compile a separate lookup table, which complicates the calculation of premium. Or you need to throw out everything from the list of KPIs that does not fit into the “simple direct indicator with a tolerance of 20%” scheme. But then the pay system will again become flat and will not reflect the real results of the employee's work.
- An additional calculation step is added, which also complicates the procedure for calculating the premium. After all, you first need to calculate your indicator in its physical terms (in rubles, pieces, tons, hours or even in%), then calculate the degree of its implementation by dividing the fact by the plan, and only then get the corrected degree of implementation by substituting the resulting plan-fact to the table of values. There are situations of using tables of values immediately in physical terms. For example, 2 violations of the regulations - 0% bonus, one violation - 50%, zero - 100%. But for indicators with changing plans and tolerances, such a scheme is not suitable.
3. Formula with standard
In fact, the solution is quite simple and has long been known. To calculate the degree of performance of the indicator, it is possible and necessary to use a formula that correlates the fact not only with the plan, but also with the critical value of the indicator. It looks like this:The meaning of the formula is that the difference between the fact and the critical value is considered in the numerator, because You only have to pay for the excess. Further, this difference is correlated with the permissible deviation. That is, a fact equal to the plan is taken as 100%. It `s naturally. If the fact is compared with a critical value, the degree of completion will be equal to 0% - there is no need to pay a premium for such a result. Intermediate values are calculated linearly and continuously. Schematically, the calculation logic is shown in the picture:

A comparison of the formula with the standard and the classic methods for calculating KPI described above is shown in the following picture:

As a result of using the formula with the standard, all the main tasks are solved:
- You do not pay for actual KPIs above/below tolerances.
- The premium becomes as sensitive as possible to any changes in the KPI fact within the tolerance.
- The formula is absolutely universal and suitable for any type of indicators - for direct, reverse and even corridor indicators, for each KPI for each period you can set the required tolerance, the formula does not care.
It is noteworthy that most KPI automation tools are not familiar with this formula (and automation for managing KPI is useful, we wrote about this earlier). Of course, such a formula is "hardwired" in HighPer, because we developed it with the understanding that it is impossible without it. KPI-Drive from A. Lityagin has

a universal mechanism for setting the degree of achievement of the indicator, where you can set up a formula with a standard, but only if the KPI standard does not change from month to month in% of the plan. If the tolerance "jumps", the desired setting can no longer be carried out. The rest simply stupidly divide the fact into a plan or offer tables of values. Imagine, you are buying a program that should make your life easier for several hundred or even million rubles, and it does not even allow you to enter an allowable deviation in terms of an indicator - the corresponding field is not provided in the program. This clearly shows the degree of understanding of the KPI methodology by the developers of the respective software products.
In fairness, we can add that in theory there are also other ways to calculate the degree of KPI fulfillment:
- Nonlinear (parabolic), when the function of the degree of execution is given by a power equation.
- Progressive / regressive, when the degree of completion function changes its slope depending on the interval in which the actual value fell.
- Competitive, when the best / worst employees receive / do not receive the bonus.
[Povarich B.G. Labor motivation: managerial aspect. Novosibirsk, 2008, pp. 90-92].
However, in practice, we have not seen such payment schemes - they are too complicated.
Good luck with motivating employees!
Today, almost all company executives use KPI performance indicators. But does everyone know the definition of KPI reduction? The decoding of the abbreviation is as follows - Key Performance Indicators. A literal translation from English gives us the following interpretation: key performance indicators (KPI). A slightly different interpretation has taken root in Russian practice: KPIs are the key performance indicators of an enterprise, but the essence of this, in any case, does not change.
 The KPI program is a "measuring device" that evaluates certain results of the work of a company, department, or a particular employee. They show how the set goals have been achieved. In general, KPI indicators evaluate the following characteristics:
- beneficial effect- the main task for which, in fact, the work is done. These include: net income, sales volume, revenue, production volume, market share, customer base size, customer satisfaction, organization reputation, and more.
- Side effects are unwanted results that often go hand in hand with the desired ones. For example, any kind of debt, staff turnover, etc.
- Resource costs- this is absolutely all the costs that have gone to achieve the goal.
- Time spent- How long did it take to complete the job?
- The ratio of the beneficial effect to the cost of resources / time is an objective assessment of the beneficial effect. It is in this indicator that KPIs characterize efficiency, while in others they describe performance.
What indicators can be related to KPI indicators
Practice has shown that the KPI system performs well in the field of large retail with a large branch network. It is easier for managers of the main office to evaluate the work of the company by comparing the work of departments according to schedules in a single coordinate system, to see risks, reduce them and make forecasts. But in a small business, the system works just as well, but it may be a little more difficult to develop it correctly.
There can be any number of KPI indicators, the main thing is an easy calculation of KPI, and it is also important that they really characterize the fulfillment of intermediate and final goals.
To assess the effectiveness and efficiency, the following can be distinguished:
- volume of sales- the cash flow from the sale is estimated, for example, for a month;
- staff turnover, in % - the ratio of the number of laid-off workers to the average number;
- compliance with service standards- also measured as a percentage, based on the data of mystery shoppers.
The most common indicators are highlighted here. Depending on the specifics of the organization, you can use any other.
Rules and principles of implementation, development of KPI indicators in the activities of the organization
Several methods have been developed to identify the optimal number of KPI indicators. But experience says that it is better to stick to the 10/80/10 rule. It states that there should be 10 key performance indicators, 80 operational (production) indicators, and about 10 performance indicators.
Main principle when implementing KPI, it is considered the principle of control and manageability. This means that the person or department that is responsible for the high result of the indicator should be allocated everything necessary to manage it. As a result, the result obtained must be measurable and controllable.
In addition to the main principle, there are additional ones that also help the correct construction and operation of the KPI system:
Examples of calculating KPI indicators
 Probably, every manager sooner or later asks the question: “how to calculate KPI?” Guided by these provisions, you can come up with many indicators. However, it must be remembered that each of the KPIs should characterize one of the goals. When developing KPI indicators for employees, it would be logical to build on their own tasks arising from a common strategic goal. For example, the work of a manager can be assessed by parameters such as "Growth in sales from new customers", "Customer satisfaction", etc.
The director's KPI will be somewhat more complicated. The system of criteria should contain long-term indicators. For example, "Expansion of the staff of the organization by 50% per year", also profit refers to the universal performance characteristics, even the effectiveness of the director.
In any case, the KPI of any business unit must meet certain conditions:
- Limited number of options. It should not exceed 10, and 5 criteria are considered optimal.
- Consistency. Neither indicator should interfere with the performance of the other. For example, it would be wrong to ask the sales department to "increase the number of new customers", but at the same time to order "to reduce advertising costs."
- Monitoring the implementation of indicators.
KPI of employees and directors
The construction of a KPI system for personnel is subject to general principles and rules. The selected criteria should be:
- measurable;
- specific;
- realistic;
- agreed;
- defined in time.
Advantages and disadvantages of implementing a KPI system
Like any innovation in the company, the implementation of KPI indicators has its pros and cons, well-wishers and opponents.
Advantages:
- Often, employees who influence the financial and economic condition of the company are satisfied with the implementation of the system. With the introduction of KPIs, they are usually incentivized to do better work, for which they are often rewarded with a pay rise.
- Each employee has a clearly defined area of work.
- The employee clearly sees a personal contribution to the common cause to achieve the main goals. It is very important.
- Awareness of managers about the work of each department and each employee and its full control.
Disadvantages:
- It often happens that the good work of one of the colleagues is not visible against the background of the general unsatisfactory work of his entire department. It may happen that he remains out of work. Exhausted and exhausted by hard, but unappreciated work, an employee may quit.
- Some positions will remain outside the bonus system from achieving good KPIs, because they do not directly affect them. As a result, they will be dissatisfied with it. For example, if the overall goal is related to net profit, then secretaries, accountants, economists and a number of others simply cannot even try to prove themselves somehow.
- Sometimes the KPI motivation system does not imply bonuses for good work, but fines or bonus deductions for failure to fulfill the plan. That is, if the required level of the indicator is reached, then you receive a regular salary, and if you suddenly failed to do this, then punishments will begin. It adds to the working atmosphere.
We also offer you a video that tells in detail about an example of working with KPI indicators.
KPIs are key performance indicators for a company or a separate department. In the article, we will consider examples of KPIs for various specialists and analyze how to develop and implement a system.
What is KPI
Ki ai stands for Key Performance Indicators - key performance indicators.
The KPI system is a reward system based on key indicators.
Working on such a system allows employees to better understand what they need to do in order to be effective. Moreover, efficiency refers not only to the amount of work performed by them, but also to the benefits received by the company.
How to develop a KPI system
To create a Ki Pi Eye system in a company, you need to:
- Choose a key performance indicator model.
- Determine KPIs and allocate responsibility.
- Create reporting.
How to choose a key performance indicator model
There are many methods for defining and grouping indicators. In Russia, the classical approach is most often used, as well as the balanced scorecard (Balanced Scorecard, BSC).
The classical approach is based on the use of predominantly financial indicators, such as; see figure.).
Picture. EVA based KPI tree
It should be noted that financial indicators alone may not be enough to implement the developed strategy. No less important for business is the development of customer relations, personnel management, product quality, that is, those aspects of activity that are difficult to value.
Within the framework of the balanced scorecard, four main aspects of the company's work are distinguished, which provide answers to the following questions:
- how the company is evaluated by shareholders (“Finance”);
- how it is evaluated by customers (“Clients”);
- how to improve the quality of activities (“Personnel”);
- what processes can provide a company with an exclusive position in the market (“Business Processes”).
What to choose
Which approach to choose depends on the level of business. For small companies, the classic approach is more suitable, since it does not require significant costs for attracting consultants and implementing an information system. In the future, it will be possible to refine the created classical system by including non-financial criteria in it.
Large companies should use a balanced scorecard, as it gives a more complete picture of the company's activities.
How to develop KPIs for finance staff
The editors of Sistema Financial Director prepared motivation schemes and KPI performance reports for financial service employees. Download and use examples of key accountant and other employees of the accounting department, employees, budgeting department and other departments in your company.
How to choose key indicators
To determine which KPIs to use, you need to:
- Select groups of indicators and distribute the responsibility of managers of different levels of management for each of the groups.
- Make the most detailed list of KPIs used by management.
- Select the criteria that best characterize the achievement of strategic goals.
- To formalize the algorithms for calculating each of the ki pi ai.
Selection of groups of indicators
If a company uses a classic approach to developing a KPI system, then the following groups should be distinguished:
- ;
Responsibility for each of the groups will be distributed among the leaders of all levels of management. For example, the general manager is responsible for the whole, while management should be transferred to the heads of departments.
When using a model that includes both financial and non-financial KPIs, the following groups of key performance indicators can be distinguished:
- financial and economic - for business in general;
- customer satisfaction;
- main and auxiliary business processes (see how to describe them);
- staff efficiency.
After identifying the main groups, it is necessary to determine who will be responsible for their implementation. An example of the distribution of responsibility, see table 1.
Table 1. Groups of indicators and distribution of responsibility
Detailing
The list of ki pi ai for each of the selected groups should be as detailed as possible. Ask the managers who will be responsible for a particular group to make such a list. For example, the CEO should specify what criteria he uses to evaluate "shareholder (owner) satisfaction".
As a result, several hundred criteria can be included in the general list of KPIs. It is obvious that the construction of such a system is unjustified, since it will lead to a significant increase in the workload on personnel associated with the collection and processing of data necessary for the calculation. Therefore, from the general list, you need to select those data that are really necessary for management to manage and will allow you to assess the degree of achievement of your goals, and not just be controlled “for information”.
Choosing a KPI
To select KPIs, form an expert group. As a rule, it includes directors of divisions and heads of departments. Their task is to characterize each of the indicators according to the following criteria:
- whether it reflects the degree of achievement of the company's strategic goals;
- whether it is understandable, first of all, to those managers who will have to make a decision based on it;
- whether it is useful for decision making.
In addition to those listed, other criteria may be applied, for example, the ability to use performance indicators in planning or analysis.
The evaluation procedure can be formalized based on the use of a scoring system. For example, 1 point - the criterion is not met, 2 points - partially meets the specified criterion, 3 points - meets the specified criterion. The indicators that receive the highest number of points during the peer review will be included in the CI system.
As a result, a "short" list of key performance indicators of the company will appear (see table 2).
table 2. An example of a ki pi trading company(fragment)
|
KPI group |
Key performance indicators |
Responsibility |
|
Satisfaction scores |
||
|
Shareholders |
Return on total assets, return on equity, return on sales or rate of return, return on cash flow |
CEO |
|
Sales market share, number of defects in products, number of customer complaints, turnover of active customer customers, duration of the functional order fulfillment cycle, availability of inventory for customers |
||
|
Staff |
Depending on the specifics, as well as on the information needs of managers, management reporting can be generated in a variety of analytics (brands, product groups, personnel categories, types of assets, distribution channels, etc.). ConclusionIn the process of creating a KPI system, you will have to face various problems: the resistance of employees, the need to adjust accounting policies for the purposes of accounting and management accounting; ensure the collection of the necessary data for the calculation of selected key performance indicators; etc. However, organizations that have implemented KPIs, as a rule, achieve good results, since the company creates a system of performance indicators that is understandable to management, and responsibility for management is delegated to a wide range of managers. After the implementation of the KPI system, it is important to constantly analyze its relevance, since business processes, strategic goals, and the external environment may change in the company, so some indicators may lose their relevance, others may lead to unplanned results. | |
The bonus begins with an assessment, and you also need to remember the basic principle: the variable part of the salary is designed to stimulate labor activity and should encourage the achievement of above-standard results. And you should always remember that the bonus is not part of the salary. After all, the deprivation of the bonus in this case creates stress, conflicts and leads to demotivation of the staff.
The performance related pay (PRP) system is based on a staff assessment procedure based on key performance indicators (KPIs). However, in order to introduce such a system into management practice, simple and reliable methods should be developed that establish a relationship between the employee's KPI values and the value of the variable part of the salary.
Personnel assessment by KPI
Earlier in our journal, a methodology for assessing personnel by KPI was published, based on a combination of the current assessment of the results and competencies of employees. Let us briefly recall its main provisions.
For each position in the organization, on the basis of the employee's service functions, two models (tables) are developed - results and competencies. The first lists all performance criteria for performance evaluation: quantitative and qualitative, individual and team. In the second - the competencies required for this position: corporate (common for all staff of the company), managerial and expert (vocational). From these two models, 5-7 key indicators (of any type) are selected to assess the results and competencies of the employee in the coming month (quarter or other reporting period - depends on the position level) and are recorded in a personal performance table (see Table 1). At the same time, competencies are “equated” with the qualitative results of the employee’s activities. Each of the selected indicators, in accordance with the priorities of the immediate supervisor, is assigned a weight - from 0 to 1 (the total weight should be 1).
Table 1. Personal performance
|
Key indicators (KPI) |
The weightKPI |
Base |
Norm |
Target |
Fact |
Partial result, % |
For all indicators, three “performance levels” are set:
1. Base - the worst admissible value ("zero" point), from which the countdown of the result begins.
2. Norm - a level that must necessarily be achieved taking into account the circumstances (for example, the situation on the market), the characteristics and complexity of the work, and the capabilities of the employee. This is a satisfactory indicator value.
3. Purpose - above-standard level to which it is necessary to aspire.
At the end of the month (quarter), the actual KPI values are evaluated. At the same time, quantitative indicators are measured on a “natural” metric scale, and qualitative indicators are measured on an ordinal 100-point scale. With its help, you can be flexible in assessing quality KPIs by setting “reference points”, for example: base - from 0 to 20, norm - from 40 to 60, goal - from 80 to 100 points. At the same time, assessments must be “deciphered” so that employees understand exactly what results internal customers expect from them.
After evaluating the actual value of KPI, a particular result of work on this indicator is determined in accordance with the formula:
This result reflects the degree of fulfillment or overfulfillment of the norm. So, if the actual indicator is below the norm, then the partial result for it is from 0 to 100%. If the “fact” exceeds the norm, then the partial result is above 100%.
After evaluating each indicator, the employee's rating is determined. To do this, particular results (in percent) are multiplied by the weight of the corresponding KPIs and added together. The result is a "weighted average" performance ratio, reflecting (in percent) the overall performance of the employee for the reporting period, taking into account the importance and actual values of all his KPIs. If the coefficient is more than 100%, this indicates a person’s high performance (above the norm), if less, it means that the norm has not been achieved for some or even all indicators, and the overall result of the work is below the established level.
Next, you should link the received estimates and the amount of the employee's bonus. To do this, it is necessary to remember the basic principle of bonuses: the variable part of the salary is intended to stimulate the labor activity of people and should encourage them to achieve above-standard results. In Russian practice, there are cases when the bonus is actually considered as part of the salary and is paid “automatically” when the plan is fulfilled. If the employee does not reach the standard indicators, then he loses the bonus in whole or in part. This practice creates nervousness, stress, conflicts and leads to demotivation of the staff. The variable part of the salary should encourage people to achieve higher results compared to the normative ones. And for the implementation of the plan, the employee should receive a salary. It is important that the fixed part of the salary remains constant! Based on these considerations, we will consider two ways to calculate the bonus if the employee's KPI estimates are known.
The first way to calculate the premium
The variable part of the salary (performance bonus) is calculated as a percentage of the official salary using the employee's performance ratio according to the formula:
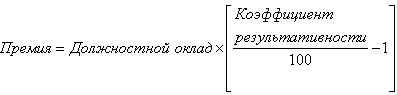
Of course, this formula is applicable only to those employees whose performance ratio is above 100%, i.e. who have reached above-standard indicators, taking into account the values of all KPIs and their weights. Otherwise, these persons do not receive the bonus. The amount of the payment is limited by the employee's bonus fund.
Consider an example. The work of the shop manager for the past reporting period (month, quarter, half year, year) was evaluated according to five key indicators (see Table 2).
Table 2. Premium calculation example (method 1)
|
Key figures |
Weights |
Base |
Norm |
Target |
Fact |
Result |
|
Volume of production |
3 million rubles |
5 million rubles |
6 million rubles |
5.5 million rubles |
||
|
Share of defective products |
||||||
|
150 thousand rubles |
90 thousand rubles |
60 thousand rubles |
75 thousand rubles |
|||
|
Performance ratio: |
||||||
|
Job salary: Performance Award: |
||||||
Suppose that the official salary of the head of the shop is 40,000 rubles. Then his bonus based on the results of work will be 9.3% of the salary: 40,000 rubles. × 0.093 = 3720 rubles.
As can be seen, for two indicators (“share of production by assortment” and “satisfaction of internal customers”), the results were below the standard. However, the overall result (109.3%) is above the norm, and therefore the employee is given a bonus based on performance.
Thus, the bonus is calculated as a percentage of the official salary, depending on the employee's performance ratio.
The second way to calculate the premium
The total performance bonus is calculated on the basis of the employee's bonus fund as the sum of "private" bonuses earned for each KPI separately. If the size of the bonus fund is known, then the maximum bonuses for all KPIs are first determined depending on their weights:
Then the actual premium for each KPI is calculated as a fraction of the maximum premium, depending on how much the actual value of this indicator exceeds the norm:
This formula is applicable only for those indicators for which the "fact" is greater than the "norm". Otherwise, the premium for this indicator is not charged. Then the private bonuses for all KPIs are added up, and the total employee bonus is displayed:
Let's go back to our example. Suppose that the employee's bonus fund is 40% of the official salary, i.e. 40 000 rub. × 0.4 = 16,000 rubles. Then, when using the second method of calculating the bonus, the personal performance table will be different (see Table 3).
Table 3 Premium calculation example (method 2)
|
Key figures |
Weights |
Norm |
Target |
Fact |
Max. premium |
Fact. premium |
|
Volume of production |
5 million rubles |
6 million rubles |
5.5 million rubles |
|||
|
Share of production by assortment |
||||||
|
Share of defective products |
||||||
|
Logistics costs |
90 thousand rubles |
60 thousand rubles |
75 thousand rubles |
|||
|
Satisfaction of internal customers |
||||||
In this case, the maximum bonus for each KPI is determined as a share of the bonus fund in accordance with the weight of this indicator and is accrued upon reaching its target value. For example, for the criterion "output": 16,000 rubles. × 0.35 = 5600 rubles. The same is true for other indicators. In addition, the actual premium for each of them is charged only if the "fact" exceeds the "norm". So, in the above example, for two indicators - "share of production by assortment" and "satisfaction of internal customers" - the standard is not met, so the premium is not accrued. For other indicators, the premium is calculated as follows:

If we add up the actual bonuses for all KPIs, we get the total employee bonus: 2800 rubles. + 800 rub. + 800 rub. = 4400 rubles.
Thus, the premium for each KPI is calculated as a share of the maximum premium, depending on how much the actual value of this indicator exceeds the standard one.
Choice of method
Let's figure out which of the two methods of calculating the premium described above is preferable.
First way - tougher for employees, because it hides a "penalty" for failure to comply with the norm for certain KPIs. If, according to these performance indicators, the result is less than 100%, then the performance coefficient decreases and, as a result, the employee's bonus decreases. Thus, the first way of calculating it stimulates people to a greater extent to pay attention to all indicators, and not just the most important ones. However, it should be borne in mind that the base KPI values should not be overestimated or underestimated. Otherwise, this may lead to the fact that the result (in percent) for these indicators will be inadequately high, if the "fact" turns out to be even slightly more than the "norm", or too low - otherwise. It is clear that this will distort the performance ratio. In other words, the range between "base" and "norm" should be wide enough to increase the robustness of the valuation and premium calculation results.
Second way - softer and "democratic", because it does not imply a "fine". As noted above, the premium for indicators for which the norm is not reached is simply not charged.
On the one hand, this is good, because the threat of punishment to many people is annoying and demotivating. In fact, the "penalty" for not meeting the norm is a hidden deduction from the permanent part of the salary, which contradicts one of the basic principles of wages: the permanent salary must remain constant. If the standard is not met, one should not blame the person, but figure out why this happened. After all, in any organization everything is interconnected, and the reasons can be very diverse. And the award should not be a means of punishment for omissions, but an instrument of encouragement for achievements.
On the other hand, this is bad, because employees may simply ignore some indicators that they “do not like”, or do not make any efforts to fulfill their duties if they realize that they are not coping with the standard. Due to the fact that the "automatic" punishment is not included in the calculation of the bonus, the burden on the immediate supervisor increases. To avoid this, the leader must work with subordinates, find out the reasons for low results and motivate people in other ways, primarily intangible.
Recently, the scope of application for the procedure for assessing the productivity of employees has been expanded - it has become used not only for top managers. Evaluation of key performance indicators (KPI employees) has ceased to be a hallmark of foreign companies, case studies can be found in different industries and for a wide variety of categories of employees from marketers and business analysts to financiers and economists.
Managers are assessed by competencies by Aleksey Shirokopoyas, Expert in the development and assessment of managerial competencies. Developer of educational and game programs. Project founder. 8-926-210-84-19. [email protected]
Typically, KPI-based motivation systems measure key performance indicators (KPIs of employees) because they are based on SMART criteria. Therefore, such motivation systems are convenient for applying to employees employed in profit centers, where there are objective, and most importantly, measurable criteria: sales volumes, financial key performance indicators (KPI employees), deadlines, etc., and work based on SMART -goals and objectives, has a specific result. However, not all types of work can have such goals and objectives. For example, how to evaluate process activities (which do not imply the achievement of a specific result), where there are no SMART tasks and those who are "remote" from the economic and operational processes of the company - "clerks": a secretary, a call center operator, a system administrator of a support service, HR inspector, accountant, personnel officer, etc.? These workers (back office) perform routine functions, and, unlike the work of managers, the work of "clerks" is difficult to evaluate. How to assess the quality side of the work of this category of personnel?
Key performance indicators (KPI employees) - what should I pay attention to?
In this case, it is necessary to evaluate the performance of functions. To a large extent, this is only a qualitative assessment, and, as you know, a qualitative assessment is an expert assessment. The method proposed in the article helps to evaluate the work from this side.
Each leader appreciates in his employees the ability to perform work quickly and efficiently. And laments when these requirements are not met. Often he has to put up with this and hope that he will someday find a better employee, but everything repeats with a new employee. Why is this happening? To answer this question, let's delve into the nature of the parameters under consideration and their relationship.
What is "working speed"? From physics, we know that speed is the ratio of the amount of work to the time it takes to complete it. This means that the manager evaluates his employee according to three parameters: the amount of work, the time it takes to complete it, and the quality of the work.
Thus, any activity can be evaluated by three key performance indicators (KPI employees), let's call them the "efficiency triad" (see Appendix):
- Number of work- production rate, share of excess production, additional assignments in excess of the job description, etc.
- Quality of work– technology compliance, error-free, no customer complaints, defects, etc.
- Work completion time- compliance with the set deadline, early implementation, exceeding deadlines, etc.
Moreover, each leader can decide for himself what kind of work he evaluates:
- the number of operations per job function (for example, the function of a lawyer is the preparation of contracts, and the number of contracts is the number of operations in this function);
- the scope of functions in excess of the standard, which is determined by the job description (for example, a lawyer according to the standard must process at least 100 contracts monthly);
- solution of additional tasks, instructions of the head beyond official functions (projects, one-time tasks, etc.).
However, it is not so easy to "reconcile" the speed of work and quality. Indeed, one can be convinced that it is easy to implement only any two parameters of the "triad" and it is difficult to make sure that all tasks are completed on time, efficiently and in the right amount. It is difficult to balance such a system - and this is the responsibility of the leader.
Most often, the work is done efficiently and on time, but perhaps this will not be the entire amount of work. Often an employee manages to complete all tasks, but either with a decrease in the quality of some of them, or with violation of deadlines.
And you can completely forget about the expectations of early completion of all tasks while maintaining excellent quality to the authorities. Not only that, managers are accustomed to seeing an employee's ability to complete an increased volume of tasks ahead of schedule and with superior quality as signs of underutilization rather than talent. Isn't this the reason for the modern personnel trend of "talent search"? The employers' dream of so-called talent is the dream of employees who are able to sustainably fulfill these three criteria to the fullest. Agree, there are not so many of them.
In itself, accounting for tasks and functions is a creative matter. They have different significance, which means they should be with different weights. In addition, all key performance indicators (KPIs of employees) can have their own weight in the system (see Table 1), which is determined by the manager based on current tasks, work characteristics, etc., thereby highlighting what is most important. For example, timing is important for the recruitment department, and quality is important for the accounting department.
The final grade is calculated as a weighted average of grades. This is the sum of the products of the assessment for each of the key performance indicators (KPI employees) and its weight:
35% x 3 + 40% x 4 + 25% x 1 = 1.05 +1.6 + 0.25 = 2.9 (with a maximum of 4 points)
or
35% x 75% + 40% x 100% + 25% x 25% = 26.25% + 40% + 6.25% = 72.5%
The second option for calculating the final score of this technique is given in the Appendix.
It is worth repeating: naturally, such assessments are subjective. If the scope of work can be determined and the time frame is measurable, then the quality (in the absence of specialized measurements, for example, the number of customer complaints or the results of a mystery shopping assessment) is assessed subjectively.
Key performance indicators (KPI employees) - what increases the objectivity of the methodology?
First of all, evaluation criteria are formulated in a special way. This was not done by chance: after a month, the manager cannot always remember in detail which deadlines were violated and how many cases the employee completed with proper quality. However, he developed a general, holistic picture of the work of a subordinate, written in “large strokes”. With the same "large strokes" he is invited to draw a "portrait of efficiency" of the employee.
Secondly, the objectivity of the methodology increases the practice of its application. More than ten years of experience in using the methodology shows that the effectiveness is high when it is filled out by both the manager and the employee himself. They then discuss their results, and this makes a lot of sense:
- the employee remembers his tasks better, and the manager can forget something, confuse, because he has several subordinates;
- the manager has his own view on quality issues, while the employee tends to forgive himself for minor “sins”;
- the manager is often inclined to consider the violation of deadlines as low quality of work, confusing these concepts, and the employee may be proud of the quality of the work, while neglecting the value of meeting deadlines or volume.
Thirdly, by virtue of these effects, both sides strive to reach an agreement, which, as the satirists have formulated, is "the product of non-resistance of the parties." Since the main practical application of this method is the ability to regulate the monthly or quarterly premium (see Table 2), it is this circumstance that makes the technique valuable, because agreement leads to justice, and this is more important than the accuracy of measurements, and motivates more than mathematically accurate and sometimes impersonal scores.
Fourth, the objectivity of the methodology increases due to the “scale effect” if it is applied in all divisions of the company. This effect makes it possible to compare the result with objective data, and this is another powerful verification criterion and a source for correcting results. So, a senior manager, having received a complete picture of the assessments for the company (a set of performance assessments of managers employed in profit centers, and assessments of the effectiveness of employees of the company's cost centers), can compare it with financial and other objective key performance indicators of an employee (KPI of employees) of the organization's efficiency in in general. It may turn out that the overall assessment of all employees according to the Efficiency Triad methodology will be overestimated compared to the objective key performance indicators (KPIs of employees) of the organization. Then the employer has the right to introduce a correction in the payment of bonuses by his authority.
Table 2 shows that employee Danilin had a vacation in February, and in accordance with the company's policy, no bonus was accrued during this time. Shirokova has a tendency to increase efficiency. For other workers, efficiency has declined.
Please note: the implementation of even 50% of the plan can be rewarded, especially since at the same time three key performance indicators (KPIs of employees) of the “triad” are difficult to achieve, and two out of three can be high due to the resource of the third. In this regard, any number less than 50% is also a definite achievement.

Key performance indicators (KPI employees) - systematic application of the method
The method can be applied in a cascade (when higher-ranking employees evaluate downstream ones), across the entire organization and regardless of whether employees have "objective key performance indicators (KPIs)" or not. The cascade application of the method gives the assessment a systematic and additional objectivity, especially when it comes to the calculation of bonuses.
And if, moreover, the method is applied for a long time, then it acquires a number of useful properties. Let's consider them.
- The higher manager, evaluating the lower one, at the same time evaluates the activities of his unit: after all, the results of the work of the manager are made up of both his personal efforts and the efforts of his subordinates. The advantage of this method is that the superior gets the opportunity to compare data and draw conclusions about the effectiveness of the manager and his subordinates, the unit as a whole, and even the management style.
So, the figure shows that the subordinates of the head of department 1 have different skills (this is clearly shown by the “mini-diagrams”): the engineer works slowly, but with high quality, the specialist works quickly, but not with high quality. The superior manager evaluates the work of the chief, and hence the entire department 1 as follows: the department solves a large amount of tasks with average quality and with some violation of deadlines. And a general analysis of the work of the entire department shows that the manager has an additional amount of tasks - in addition to those that his subordinates solve, and this may indicate problems with delegation. In addition, the activities of the boss somehow "worsen" the quality of the engineer's work and "slow down" the work of the specialist. As a result, the terms and quality of the work of the department are not above average. The head of the head of department 1, perhaps, should think about his effectiveness as a manager.
 The head of department 2 works quickly, but gives out fewer cases than his subordinate. Leading specialist slowly performs a large amount of work. This means that this boss takes on those tasks that can be solved quickly, while the quality of his work cannot be called low. Obviously, everything is in order here with delegation, quality of work and meeting deadlines, and hence with responsibility.
- Analysis of performance dynamics over time. It can be seen whether the performance of an employee increases during the probationary period or decreases over the years. The most illustrative picture is created by comparing the dynamics of efficiency assessments with other factors. So, in addition to the comparison of the level of efficiency with the vacation period shown in Table 2, one can see signs of an upcoming “burnout”, which are especially noticeable against the background of unchanged motivation, a drop or increase in efficiency associated with a change in leadership, the impact of corporate news on the productivity of employees or departments, and etc.
- Analysis of the work style of an individual employee: a comparison of different parameters of the "triad" will show the zones of its effectiveness and inefficiency. For example, one always works quickly, but not with sufficient quality, while the other solves only part of the tasks quickly and efficiently. From this, recommendations are born on the use of workers: the first one should be put in the area where speed is needed, and in relation to the second, one should also understand his motivation and interests in solving specific problems.
- Comparison of the ratings of employees allows you to judge their usefulness for the organization, and comparing the ratings of the heads of departments - to make a rating of departments and managers. So, at the end of the year, you can calculate the average or total annual estimates and determine who is more efficient and who is less and due to what factors: who is the “fastest” worker, who is the most “thorough”, who at the same time performs more tasks. At the same time, the content of labor and the employee's belonging to one or another unit do not play a role.
So, despite the obvious subjectivity of the Efficiency Triad method, its useful properties are obvious:
- the method is applicable to all positions, regardless of whether they are managerial or executive;
- employee performance evaluations can be accumulated and compared;
- accumulating estimates, you can track the dynamics of the work of individual employees and even departments, monitor the onset of "burnout", draw conclusions about their strengths and weaknesses;
- comparing the assessments of subordinates with the assessments of the manager, one can draw conclusions about the management style, identify areas of inefficiency in departments;
- due to the standard approach, the methodology is easily implemented in document management systems (Lotus Notes, MS Outlook, etc.) and ERP (based on Oracle, SAP, Microsoft, etc.), which are widely used in the corporate world;
- the method can become an addition or a common format for existing systems for assessing the effectiveness and efficiency of MVO, key performance indicators (KPI employees), bring their data to a single view.
And most importantly, this is not just another “precise tool”, but a way to mediate a dialogue between a manager and a subordinate on the issue of remuneration. After all, nothing reduces employee motivation as much as the lack of recognition and understanding of development paths. In such a dialogue, the employee can understand what his boss is dissatisfied with and what he pays attention to. In other words, the method gives motivation a very important managerial effect - feedback to the subordinate about his work.
should be calculated to diagnose corporate problems. Key performance indicators of an employee allow you to take timely measures to improve the efficiency of his work.